Overview #
A lollipop plot is essentially the same thing as a bar plot.
Visually, instead of a bar, a lollipop plot is made up of line segments with dots at the ends.

A lollipop plot is a good way to show the relationship between a categorical variable and a numerical variable.
The big advantage of a lollipop plot over a bar plot is it’s visually lighter on a plot in the sense that the object on the plot takes up less space.

Data #
A lollipop plot requires at least one categorical variable and one numerical variable.
A simple dataset that would be suitable for a lollipop plot might look something like this:
| categorical | numerical |
|---|---|
| A | 4 |
| B | 10 |
| C | 2 |
R #
There are a few ways to make lollipop plots in R. One way is to use ggplot2. Another way is to use the ggalt.
ggplot2 #
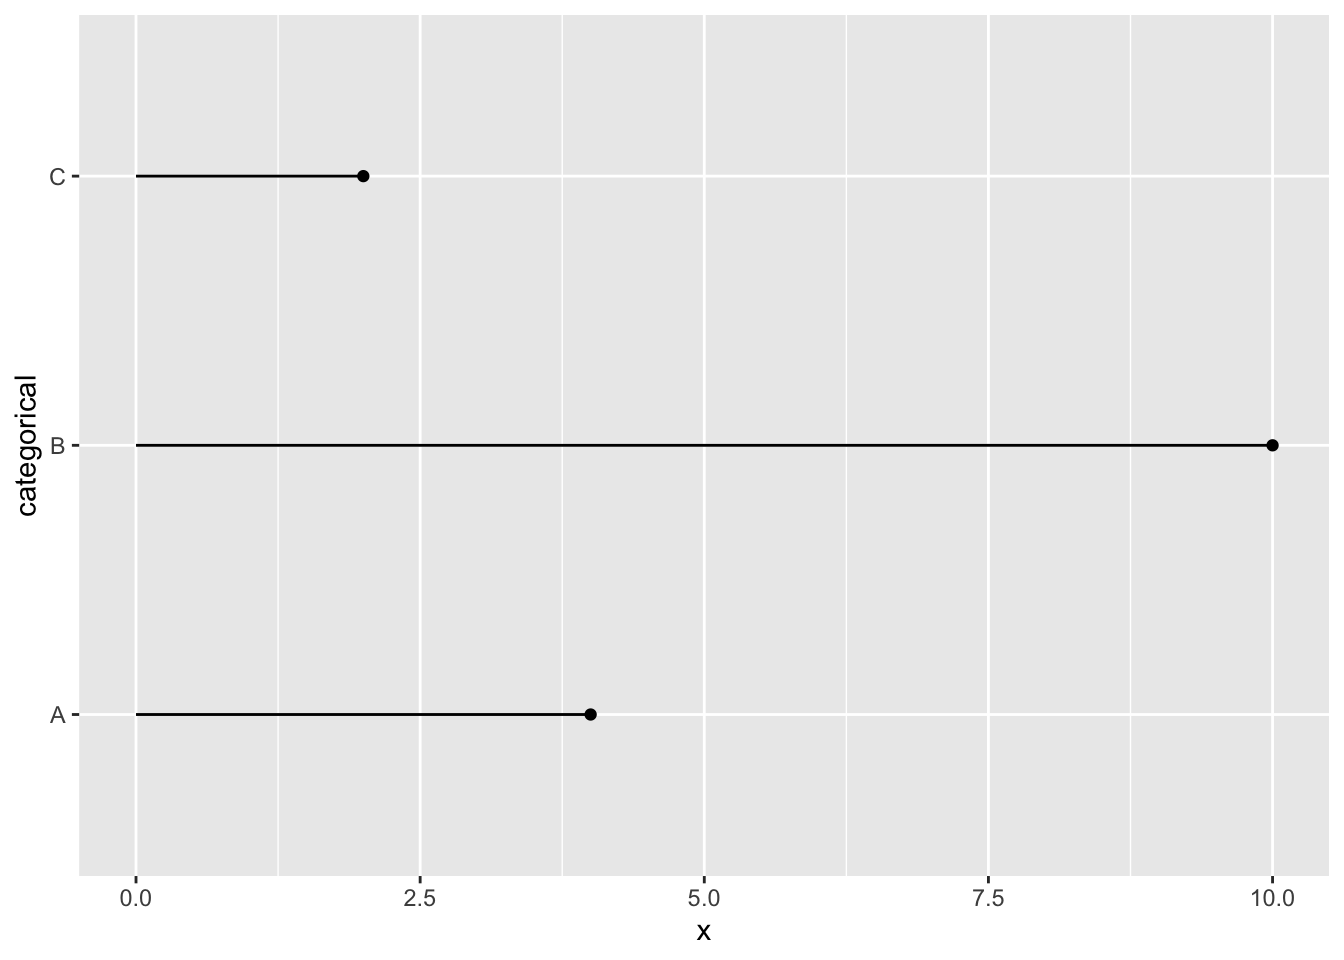
In ggplot2, a lollipop plot is generated by drawing line segments with the geom_segment function, followed by drawing dots with the geom_point function.
Note that geom_point intentionally comes after geom_segment so the point covers the end of the line segment, rather than having the line segment cover the point.
Let’s first load up ggplot2.
library(ggplot2)
Now, let’s have a look at the example data we’ll be using.
example_dat
## # A tibble: 3 × 2
##   categorical numerical
##   <chr>           <dbl>
## 1 A                   4
## 2 B                  10
## 3 C                   2
Time to whip up the lollipop plot.
example_dat %>%
  ggplot() +
  geom_segment(
    aes(
      x = 0,
      xend = numerical,
      y = categorical,
      yend = categorical
    )

  ) +
  geom_point(
    aes(
      x = numerical,
      y = categorical
    )
  )

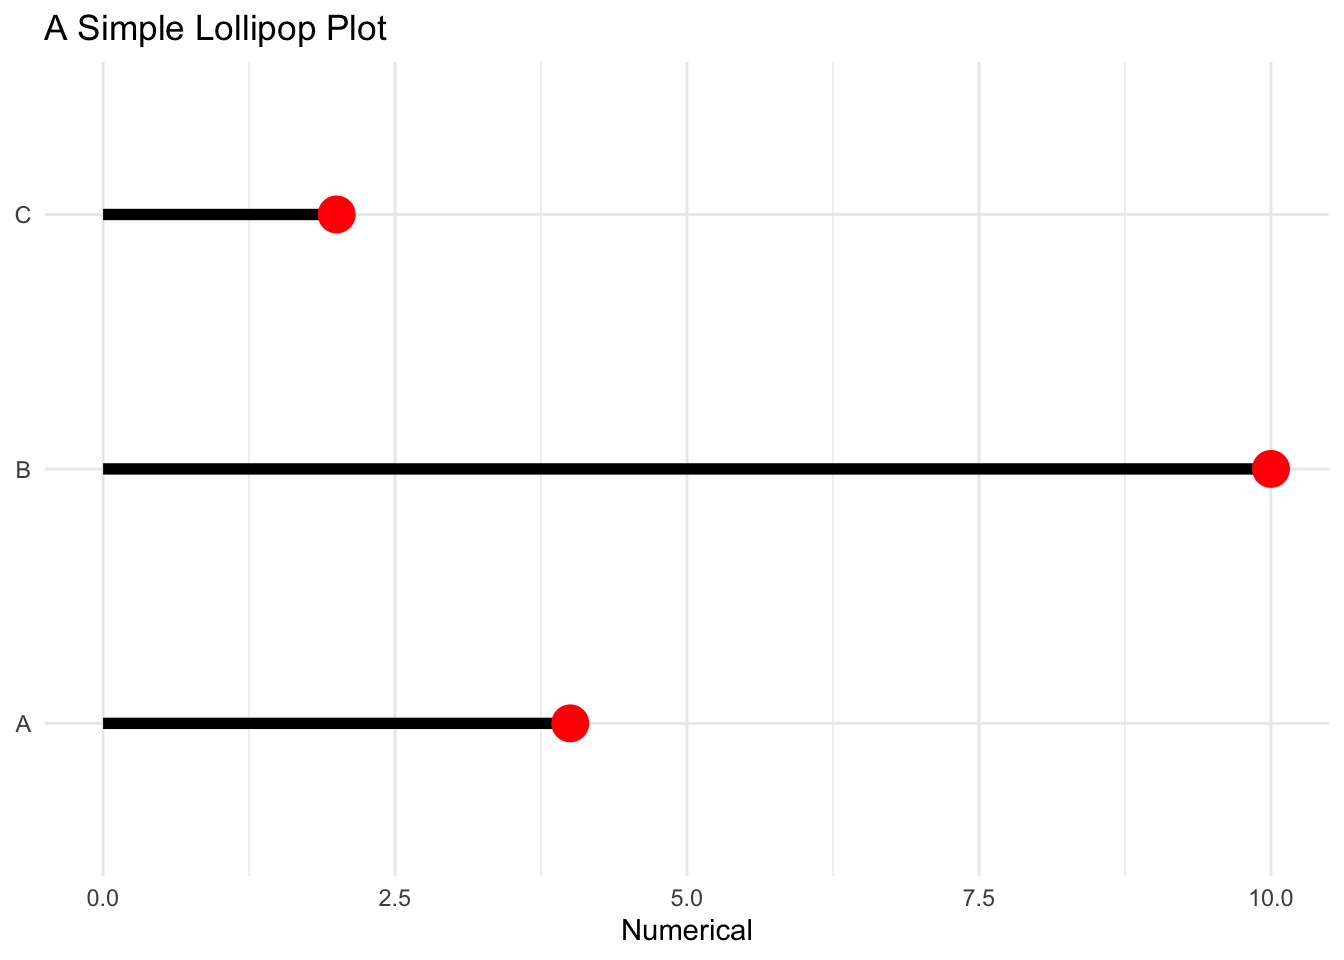
Let’s dress it up some. Let’s use a theme from the ggthemes package.
library(ggthemes)
example_dat %>%
  ggplot() +
  geom_segment(
    aes(
      x = 0,
      xend = numerical,
      y = categorical,
      yend = categorical
    ),
    size = 2 # thicker line segment
  ) +
  geom_point(
    aes(
      x = numerical,
      y = categorical
    ),
    size = 6, # bigger point
    color = "red"
  ) +
  labs( # throw in some labels
    title = "A Simple Lollipop Plot",
    x = "Numerical",
    y = NULL
  ) +
  theme_minimal() # use a theme other than the default
## Warning: Using `size` aesthetic for lines was deprecated in ggplot2 3.4.0.
## ℹ Please use `linewidth` instead.
## This warning is displayed once every 8 hours.
## Call `lifecycle::last_lifecycle_warnings()` to see where this warning was
## generated.

ggalt #
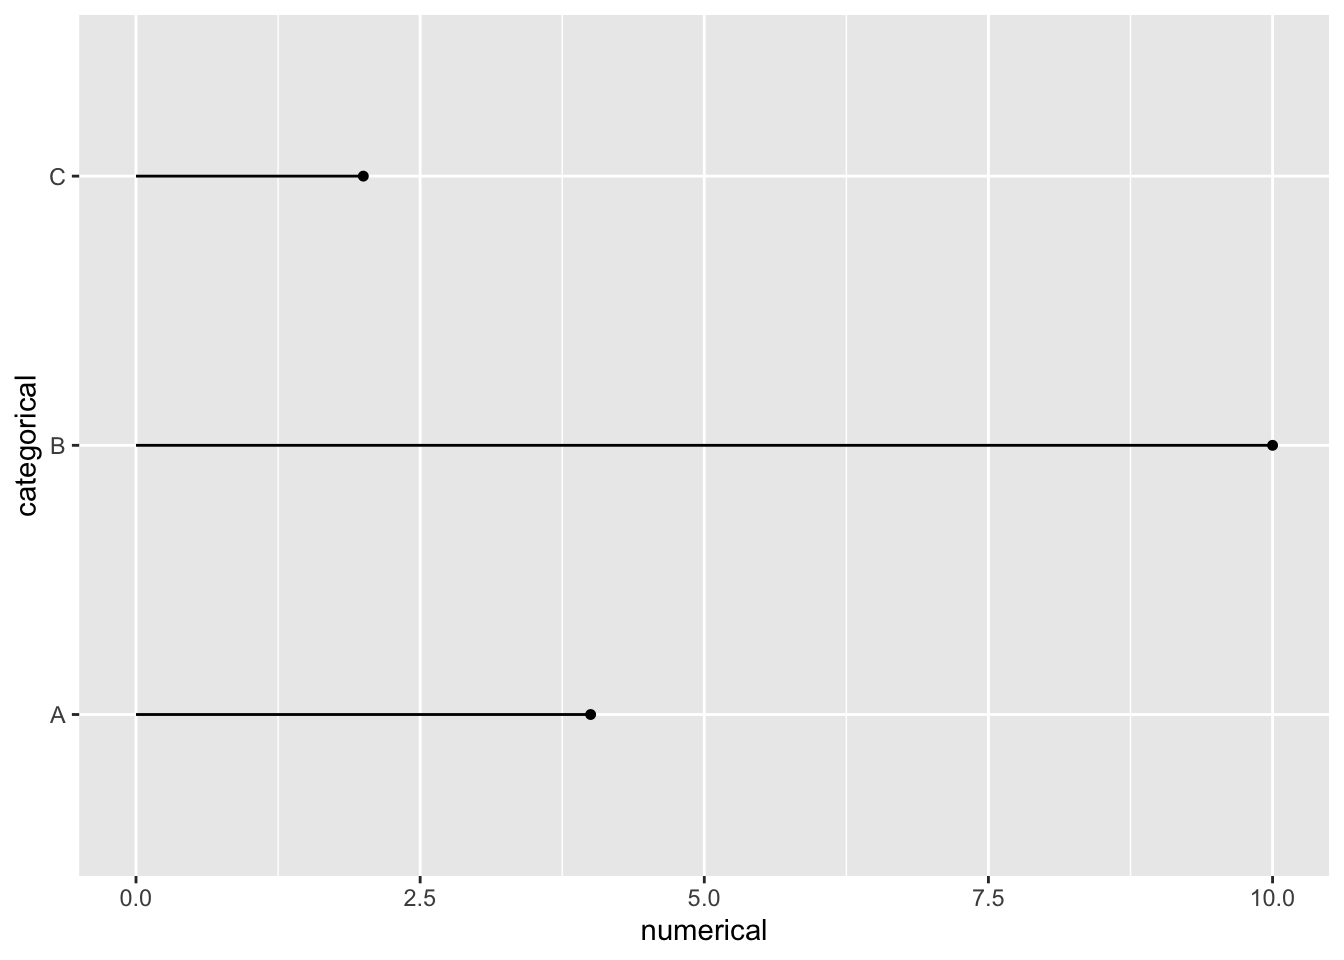
The ggalt package builds upon ggplot2, and includes a geom_lollipop function that makes it easier to create lollipops.
The tradeoff compared to taking a pure ggplot2 approach is that geom_lollipop doesn’t allow for nearly as much customization.
library(ggalt)
example_dat %>%
  ggplot() +
  geom_lollipop(
    aes(
      x = numerical,
      y = categorical
    ),
    horizontal = TRUE # turn the plot sideways
  )
## Warning: Using the `size` aesthetic with geom_segment was deprecated in ggplot2 3.4.0.
## ℹ Please use the `linewidth` aesthetic instead.
## This warning is displayed once every 8 hours.
## Call `lifecycle::last_lifecycle_warnings()` to see where this warning was
## generated.

Note that we’re essentially able to get to the same basic lollipop plot as the pure ggplot2 approach, but with less code.
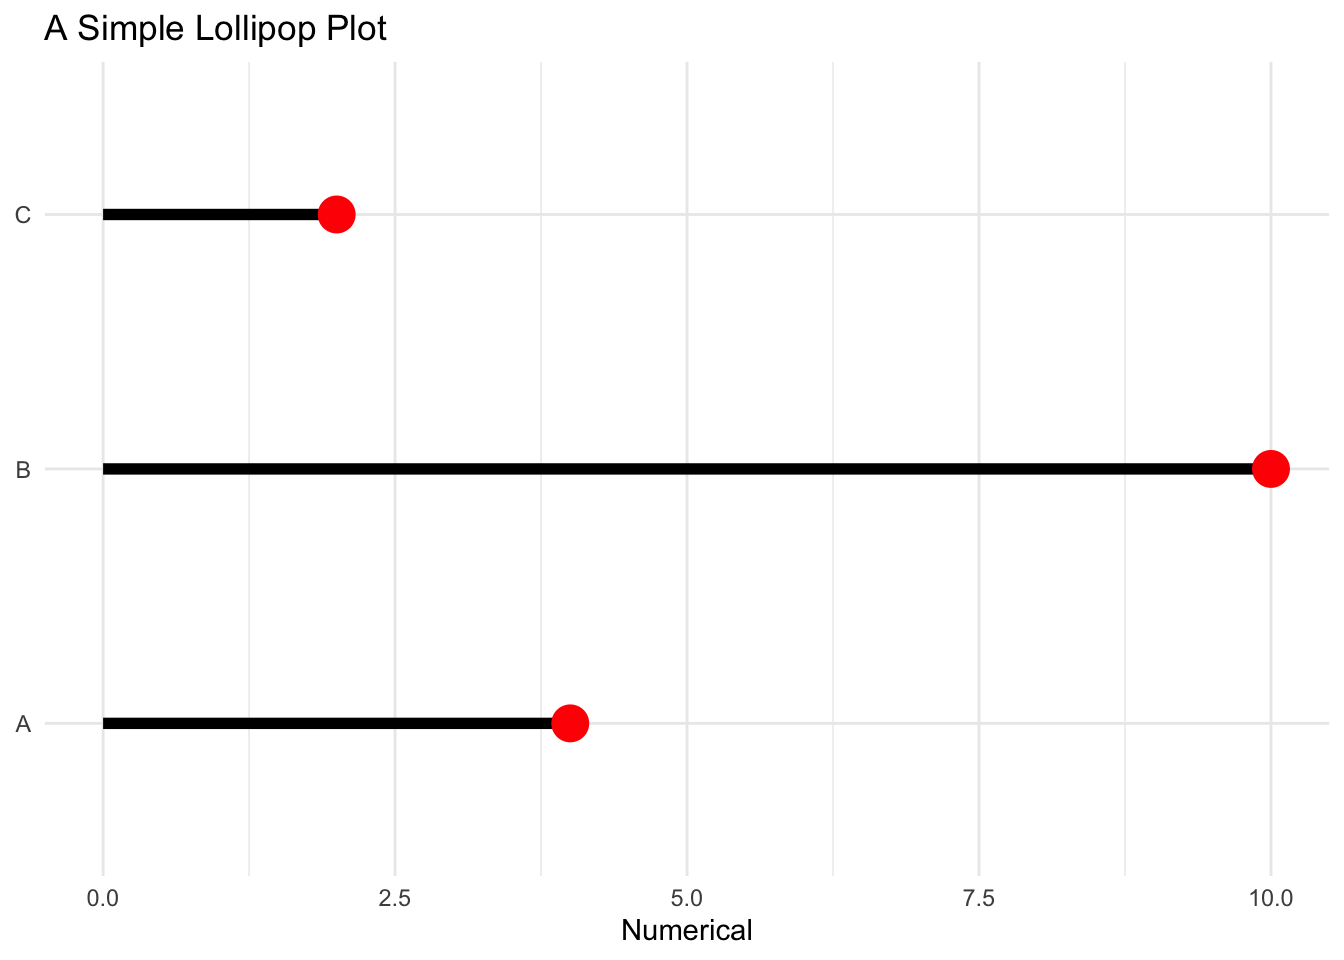
We can similarly dress up this plot generated using the geom_lollpop function.
example_dat %>%
  ggplot() +
  geom_lollipop(
    aes(
      x = numerical,
      y = categorical
    ),
    horizontal = TRUE,
    point.colour = "red",
    point.size = 6,
    size = 2 # this one controls the line segment
  ) +
  labs( # throw in some labels
    title = "A Simple Lollipop Plot",
    x = "Numerical",
    y = NULL
  ) +
  theme_minimal() # use a theme other than the default
